Mathematical Calculators
Standard Deviation Calculator
This free calculator gives you the standard deviation, variance, mean, and sum of a given data set.
Calculate the standard deviation
Data set is a:
Table of contents
Standard deviation is a statistical measure for variation or dispersion in a given data set. If the deviation is low, it indicates that data points in the data set are on average closer to the mean value of the data set. A high deviation indicates that there is more variability between data points in the data set and the values spread out over a larger range.
"SD" stands for standard deviation and is the most widely used abbreviation.
How to use this calculator?
To calculate the standard deviation with this calculator, you need to input your data set to the calculator's text field. Separate each data point with spaces, commas, or line breaks.
After inputting your data, click the "Calculate" button to find the result.
What is standard deviation formula?
The standard deviation for a data set can be calculated by the first calculating variance of the data set and then taking the square root of the variance.
The formula for variance is the sum of the squared differences between each data point and the mean. This is then divided by the number of data points.
The variance formula depends on whether you are working with data that is from a complete population, or if you are working with data that is a sample data set. When working with a complete population, the mean is divided by the size of the data set (n). If you work with a sample, divide the mean by size of the data set minus one (n - 1).
Population standard deviation
The formula for population's variance is:

To find out the deviation from the variance, you need to take the square root of variance:

Sample standard deviation
The formula for the sample data set's variance is:

To get the standard deviation for the sample from the variance, take the square root of variance:

Uncorrected sample standard deviation
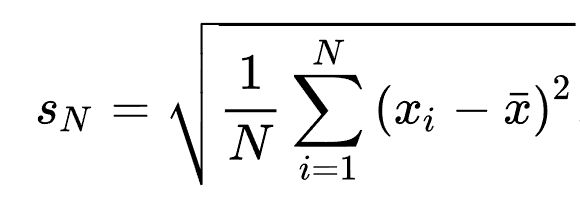
It is possible to apply the formula for the population standard deviation to the sample. You can do this by using the sample's size as population's size. This estimator is denoted by "sN" and it is known as the uncorrected sample standard deviation.
Mathematical definition of uncorrected sample standard deviation:

{x₁, x₂, x₃, ..., xₙ} = values of the sample items
x̄ = mean value of values
N = size of the sample (the square root of the variance)
Corrected sample standard deviation
Result when using the biased sample variance for estimating the population's standard deviation is:

Unbiased sample standard deviation
When working with the unbiased estimation of standard deviation, you need to remember that there is no single formula that would work for all the distributions. Instead of single formula, value 's' is used as a basis, and this is used to find out the unbiased estimate with the help of correction factor.
unbiased estimator for the normal distribution = s/c₄
You can find the correction factor by using the Gamma function:

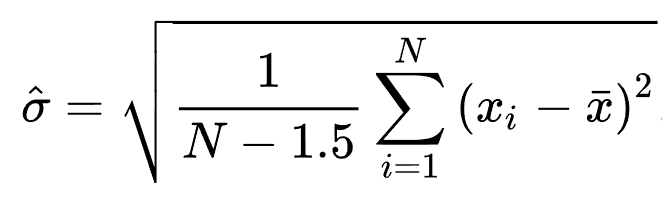
Because of 'chi distribution' we need to find out the mean of the chi distribution. This mean is used as the correction factor. You can find approximation by replacing 'N - 1' with 'N - 1.5':

This approximation is best fitting for all scenarios, except if your sample size is very small or you need very high precision. You can also refine this approximation by using the following formula instead of 'N - 1.5':
Refined approximation = N - 1.5 + 1 / (8(N - 1))
The best formula for approximation depends on your data set, but the following approximation can be used in the most cases:

Y₂ = excess kurtosis
You can estimate the excess kurtosis from the data with the following formula:
kurtosis: a₄ = m₄ / m₂²
excess kurtosis: g₂ = a₄ - 3
m = m₄ = ∑(x−x̅)⁴
m₂ = ∑(x−x̅)² / N
Applications of the standard deviation
Standard deviation is a widely used statistical tool. The most common usage for the deviation is in experimental settings in which performance is tested against real-world data. One example of this kind of performance testing is quality control.
In addition to quality control, the deviation is heavily used in the world of finance. One of the most popular financial applications for standard deviation is measuring the risk in price fluctuations of financial assets.
Standard deviation is also a very useful tool in determining regional climate differences. Two cities might have the same mean temperature, but the standard deviation of their temperatures might vary widely. For example two cities with the same mean temperature might have completely different standard deviations. First city could be very cold in winter and very hot in summer, where as the other city has about the same temperature around the year. Both cities would have the same mean temperature, but the difference between maximum and minimum temperature would be very big.
References
David, H. A., et al. “The Distribution of the Ratio, in a Single Normal Sample, of Range to Standard Deviation.” Biometrika, vol. 41, no. 3/4, [Oxford University Press, Biometrika Trust], 1954, pp. 482–93, https://doi.org/10.2307/2332728.
Delmas, R. and Liu, Y., 2005. Exploring students’ conceptions of the standard deviation. Statistics Education Research Journal, 4(1), pp.55-82.
Premaratne, G. and Bera, A.K., 2000. Modeling asymmetry and excess kurtosis in stock return data. Illinois Research & Reference Working Paper No. 00-123.
Weisstein, Eric W. "Chi Distribution." From MathWorld--A Wolfram Web Resource, https://mathworld.wolfram.com/ChiDistribution.html
Measures of Shape: Skewness and Kurtosis, Stan Brown, https://brownmath.com/stat/shape.htm
Article author
John Cruz
John is a PhD student with a passion to mathematics and education. In his freetime John likes to go hiking and bicycling.
Standard Deviation Calculator English
Published: Sun Jul 11 2021
In category Mathematical calculators
Add Standard Deviation Calculator to your own website